Saturday, September 12, 2020

Drawing Trednlines on A chart

This is very simple 

uptrending trendline 

First you need to identify that the market is making  series of Higher high and Higher Low , next identify at least two higher low and attach a line connecting them 


another option is to convert to line chart  to remove the price noice caused by the winks of the cansles 


Downtrending trendline 

You need to identify that the market is making  series of Lower Low and Lower High , next identify at least two lower High and attach a line connecting them 


i hope this was helpful tell me your thoughts on the comment section below

Thursday, September 10, 2020

Read Candlestick Trading Bible Page 116


I saw this and I wanted to show you how similar the setups are, in fact I really think this is a good opportunity , many of  you spend so much time looking for the perfect  set up, get it from me you will never get one .

On this page the author talks about using the engulfing pattern I am surprised by the similarity of the chart  I want to attach a screen shot from the page then we will compare it to the current market opportunity in USDCAD H4   10/9/2020

This set up involves a bullish engulfing pattern and a market that is making a series of Higher High and Higher Low 


I want to adjust my chart to look exactly like the one on the book


Will the set up work? 

 I honestly don’t know tell me your thoughts on the comment section below

USDCAD - LONG POSITION : 11/9/2020 TIME 04:00

Engulfing Pattern

Formed when one candle wraps over the previous one completely, engulfs the previous candle.

Shows that either the bulls or bears have gained control of the market

Engulfing patterns are more powerful than the piercing and the dark cloud cover

If it engulfs more than one previous candle, it is considered more powerful.

Consider the following factors when observing the engulfing pattern

·         Relative size of the candle body

·         Comparison between the winks with one another


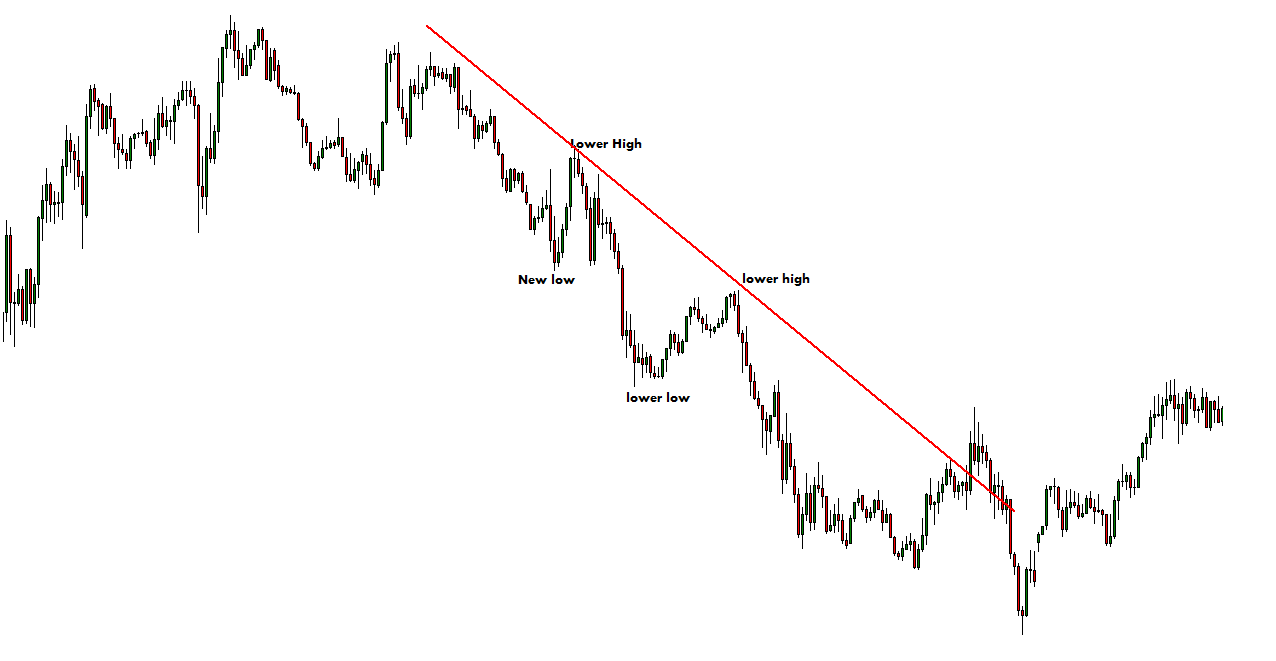
    Bear Engulfing Pattern 


See price drops after the formation of the pattern 

This pattern tells us that the bulls are no longer in control of the market. You should think of selling

First variation is you could have the winks completely engulfing the previous candle the other variation is the body and the winks engulfing the previous bullish candle. 

If it occurs at a resistance zone it is more likely that price will drop, here are other areas that can act as resistance

·         Moving averages

·         Fibonacci zones 


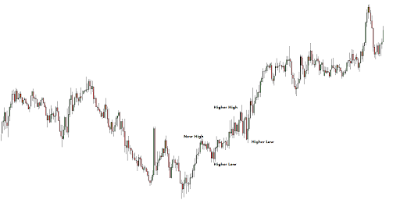
    Bullish Engulfing Pattern 


bulls come in after the formation of the pattern 

Simply tell us that bears are no longer in control of the market especially if it is at a support, the moving averages give us a direction bias

Formation of a bullish engulfing at the upward aligning moving averages tell us that the trend will continue higher


How to trade the Pattern

Always make sure you have other factors in your favor before using this pattern, find a support/ resistance zone, moving averages etc.

Make sure you get a risk to reward of 1:2


Drawing Trednlines on A chart

This is very simple  uptrending trendline  First you need to identify that the market is making  series of Higher high and Higher Low , next...